
Deliverability Insights
Overview
The Deliverability Insights dashboard displays how your Simon Mail sending is performing across key deliverability performance metrics, down to the mailbox provider, domain, IP, and even campaign level, providing the tactical insights needed to identify and address delivery or inboxing issues should they arise.
View Report
- From the left navigation, expand Reporting then click Deliverability.
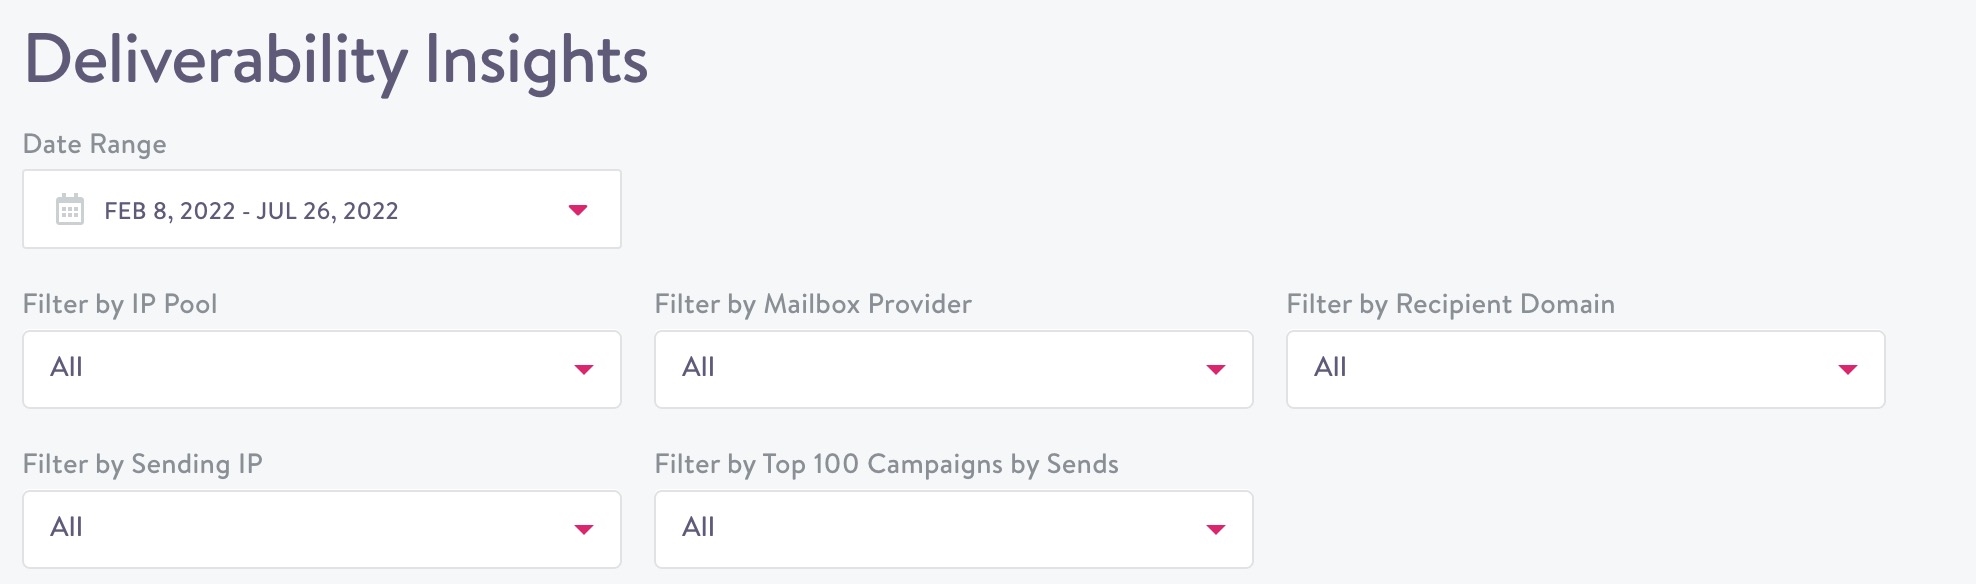
- From the drop-down, choose a date range from the pre-set filters, or choose custom to define your own. Note, these metrics are refreshed once a day so if you choose today, the metrics will be correct up to the previous day.
- You can customize the report using a number of filters:
- Filter by IP Pool: If you use more than one IP pool for your Simon Mail sending, this allows you to filter your results down to a specific IP pool. IP pools are used by senders to separate different types of messages for purposes of reputation management.
- Filter by Mailbox Provider: Mailbox Providers are the overarching organizations that provide inboxes to recipients. While some Mailbox Providers only have a single recipient domain associated with them, other Mailbox Providers may include many different recipient domains.
- Filter by Recipient Domain: isolate your stats by the recipient's email address domain for more granular analysis, especially in terms of looking at trends over time
- Filter by Sending IP: if you're sending email over more than one IP address, filtering results by IP address can help identify potential issues that might be relegated to only one of your IP addresses
- Filter by Top 100 Campaigns by Sends: isolate your results to a single campaign in order to view those results across different mailbox provider or recipient domain breakdowns to more accurately identify deliverability challenges
It may take a few minutes for the report to load:
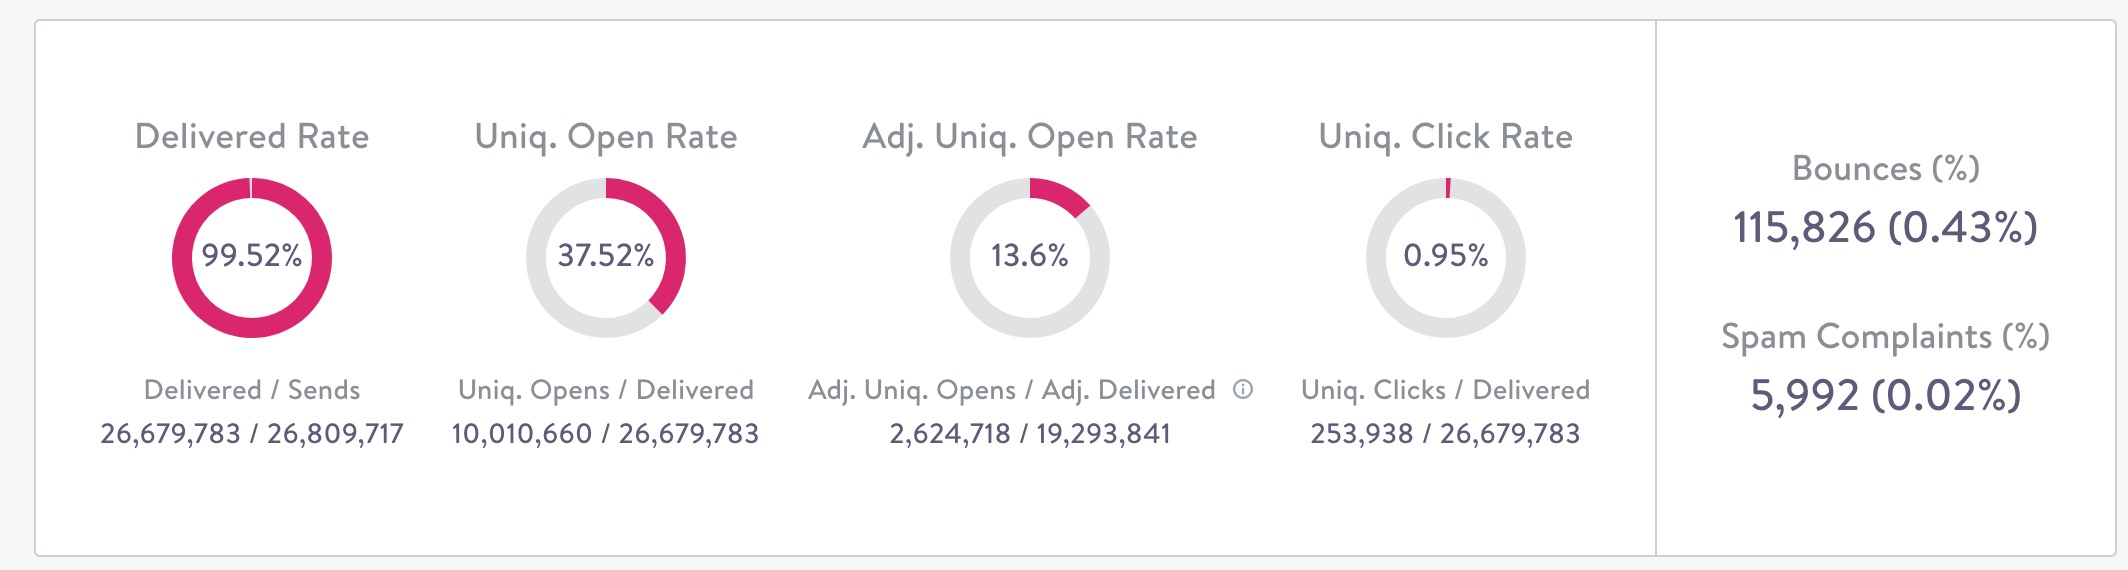
The graphs display:
- Delivered Rate: percentage of messages accepted by the receiving server
- Unique Open Rate: percentage of messages with at least one open event
- Adjusted Unique Open Rate: percentage of messages with at least one open event excluding messages where the only open event seen is attributed to image prefetching including images prefetched by Apple’s Mail Privacy Protection products
- Unique Click Rate: Percentage of messages with at least one click event
- Bounces (%): This is the percentage of emails that bounced. Learn more in Bounces.
- Spam Complaints (%): This is the percentage of email recipients that reported your email as Spam. A recipient might click 'Spam' or 'Junk' in their email client (like Gmail or Hotmail).
Metrics
Below the overview graph, hover over dates to see metrics by count:
Bounces
Click Bounce Reason to view email bounce details:
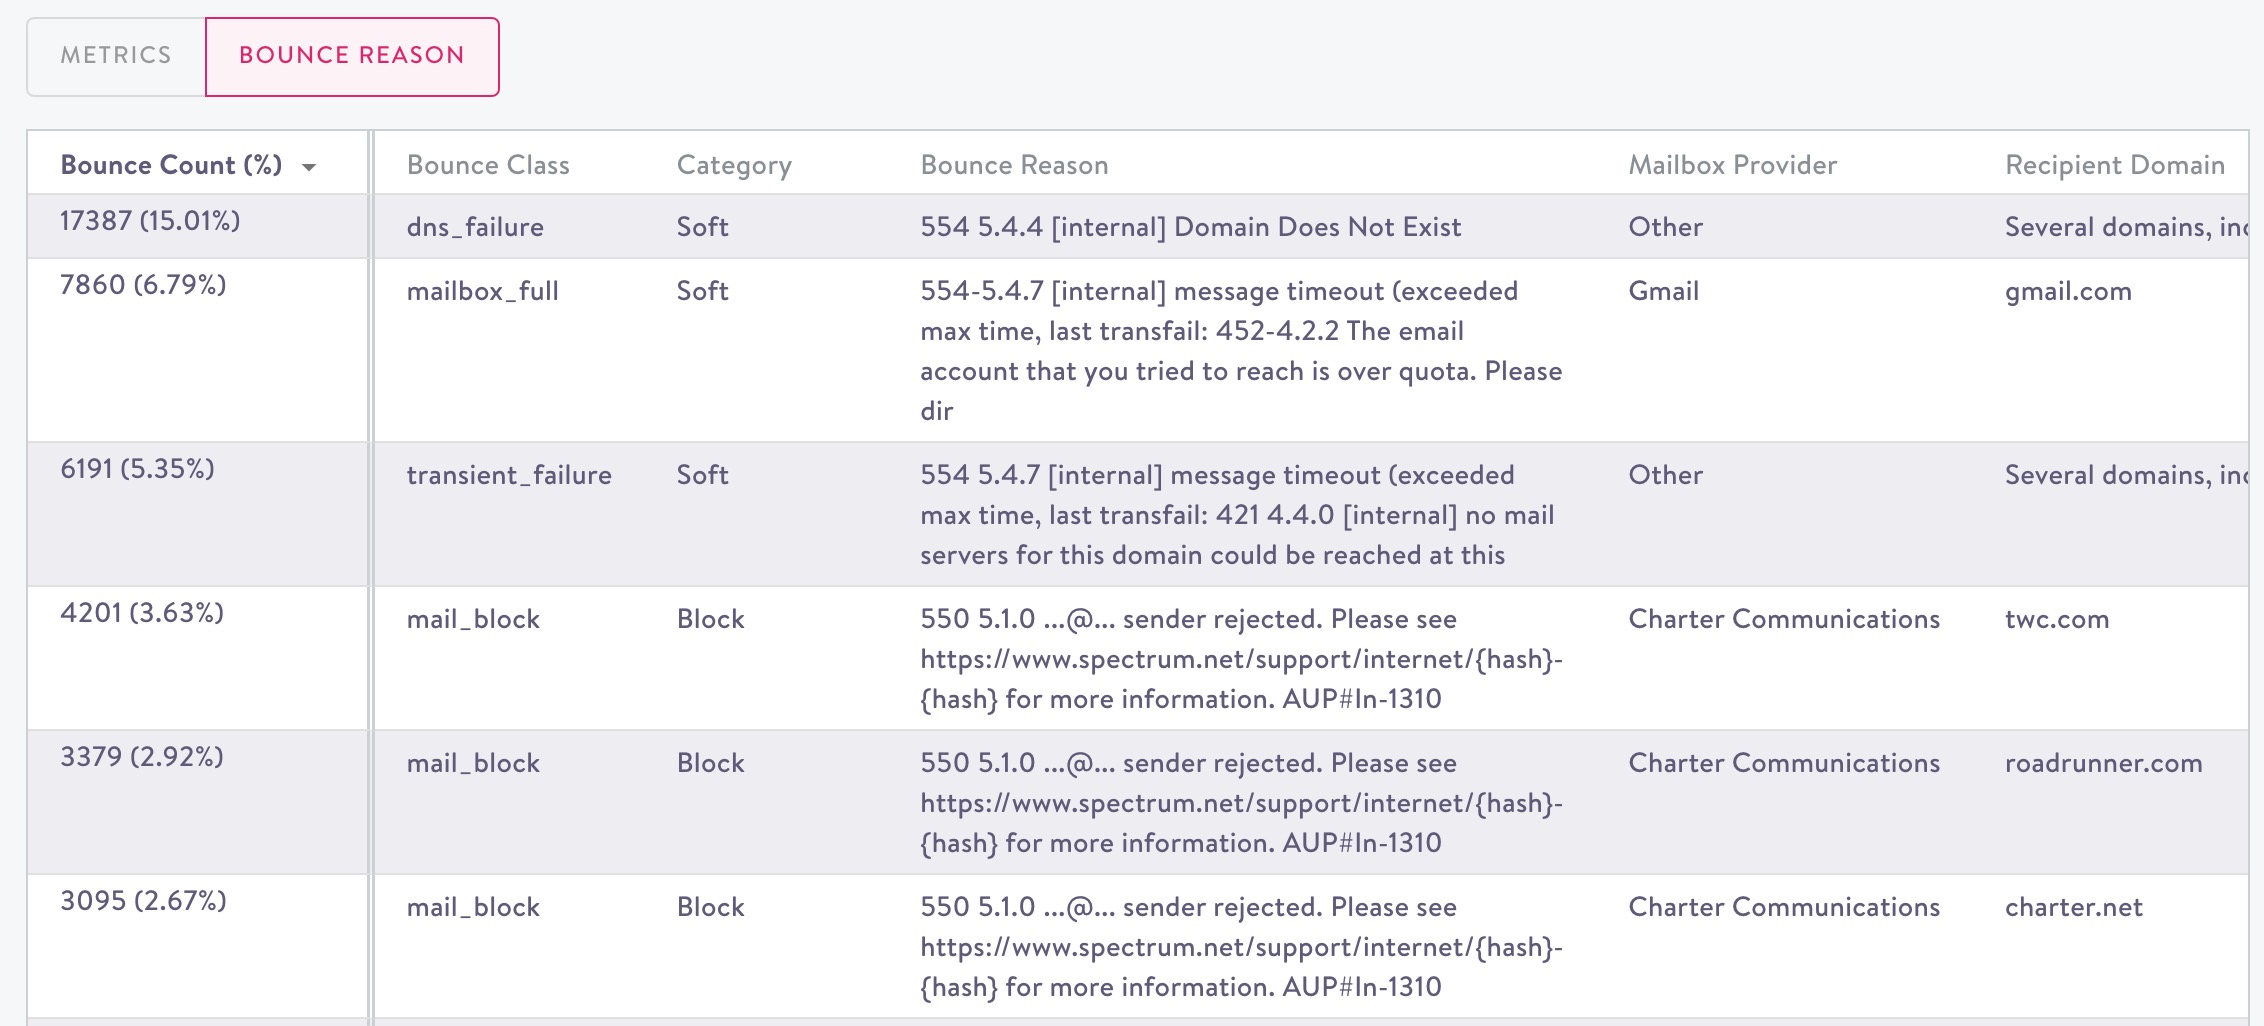
- Bounce Count (%): You can also sort by this count.
- Bounce Class: Refer to the classification codes documented here for details.
- Category:
- Hard: a message that was rejected permanently by the receiving server most often because the recipient address is not a valid address
- Soft: a message that was rejected due to an issue that might be temporary such as a full or over quota recipient inbox
- Block: a message that was rejected due to an issue that might be temporary but often related to the sender’s sending reputation such as spam content, blocklisted IP addresses or domains, or too many complaints
- Bounce Reason: This is the explanation for why a message was rejected that is provided to us by the mailbox provider.
- Mailbox Provider: Mailbox Providers are the overarching organizations that provide inboxes to recipients. While some Mailbox Providers only have a single recipient domain associated with them, other Mailbox Providers may include many different recipient domains.
- Recipient Domain: Recipient domain is the domain associated with the recipients generating this particular bounce reason
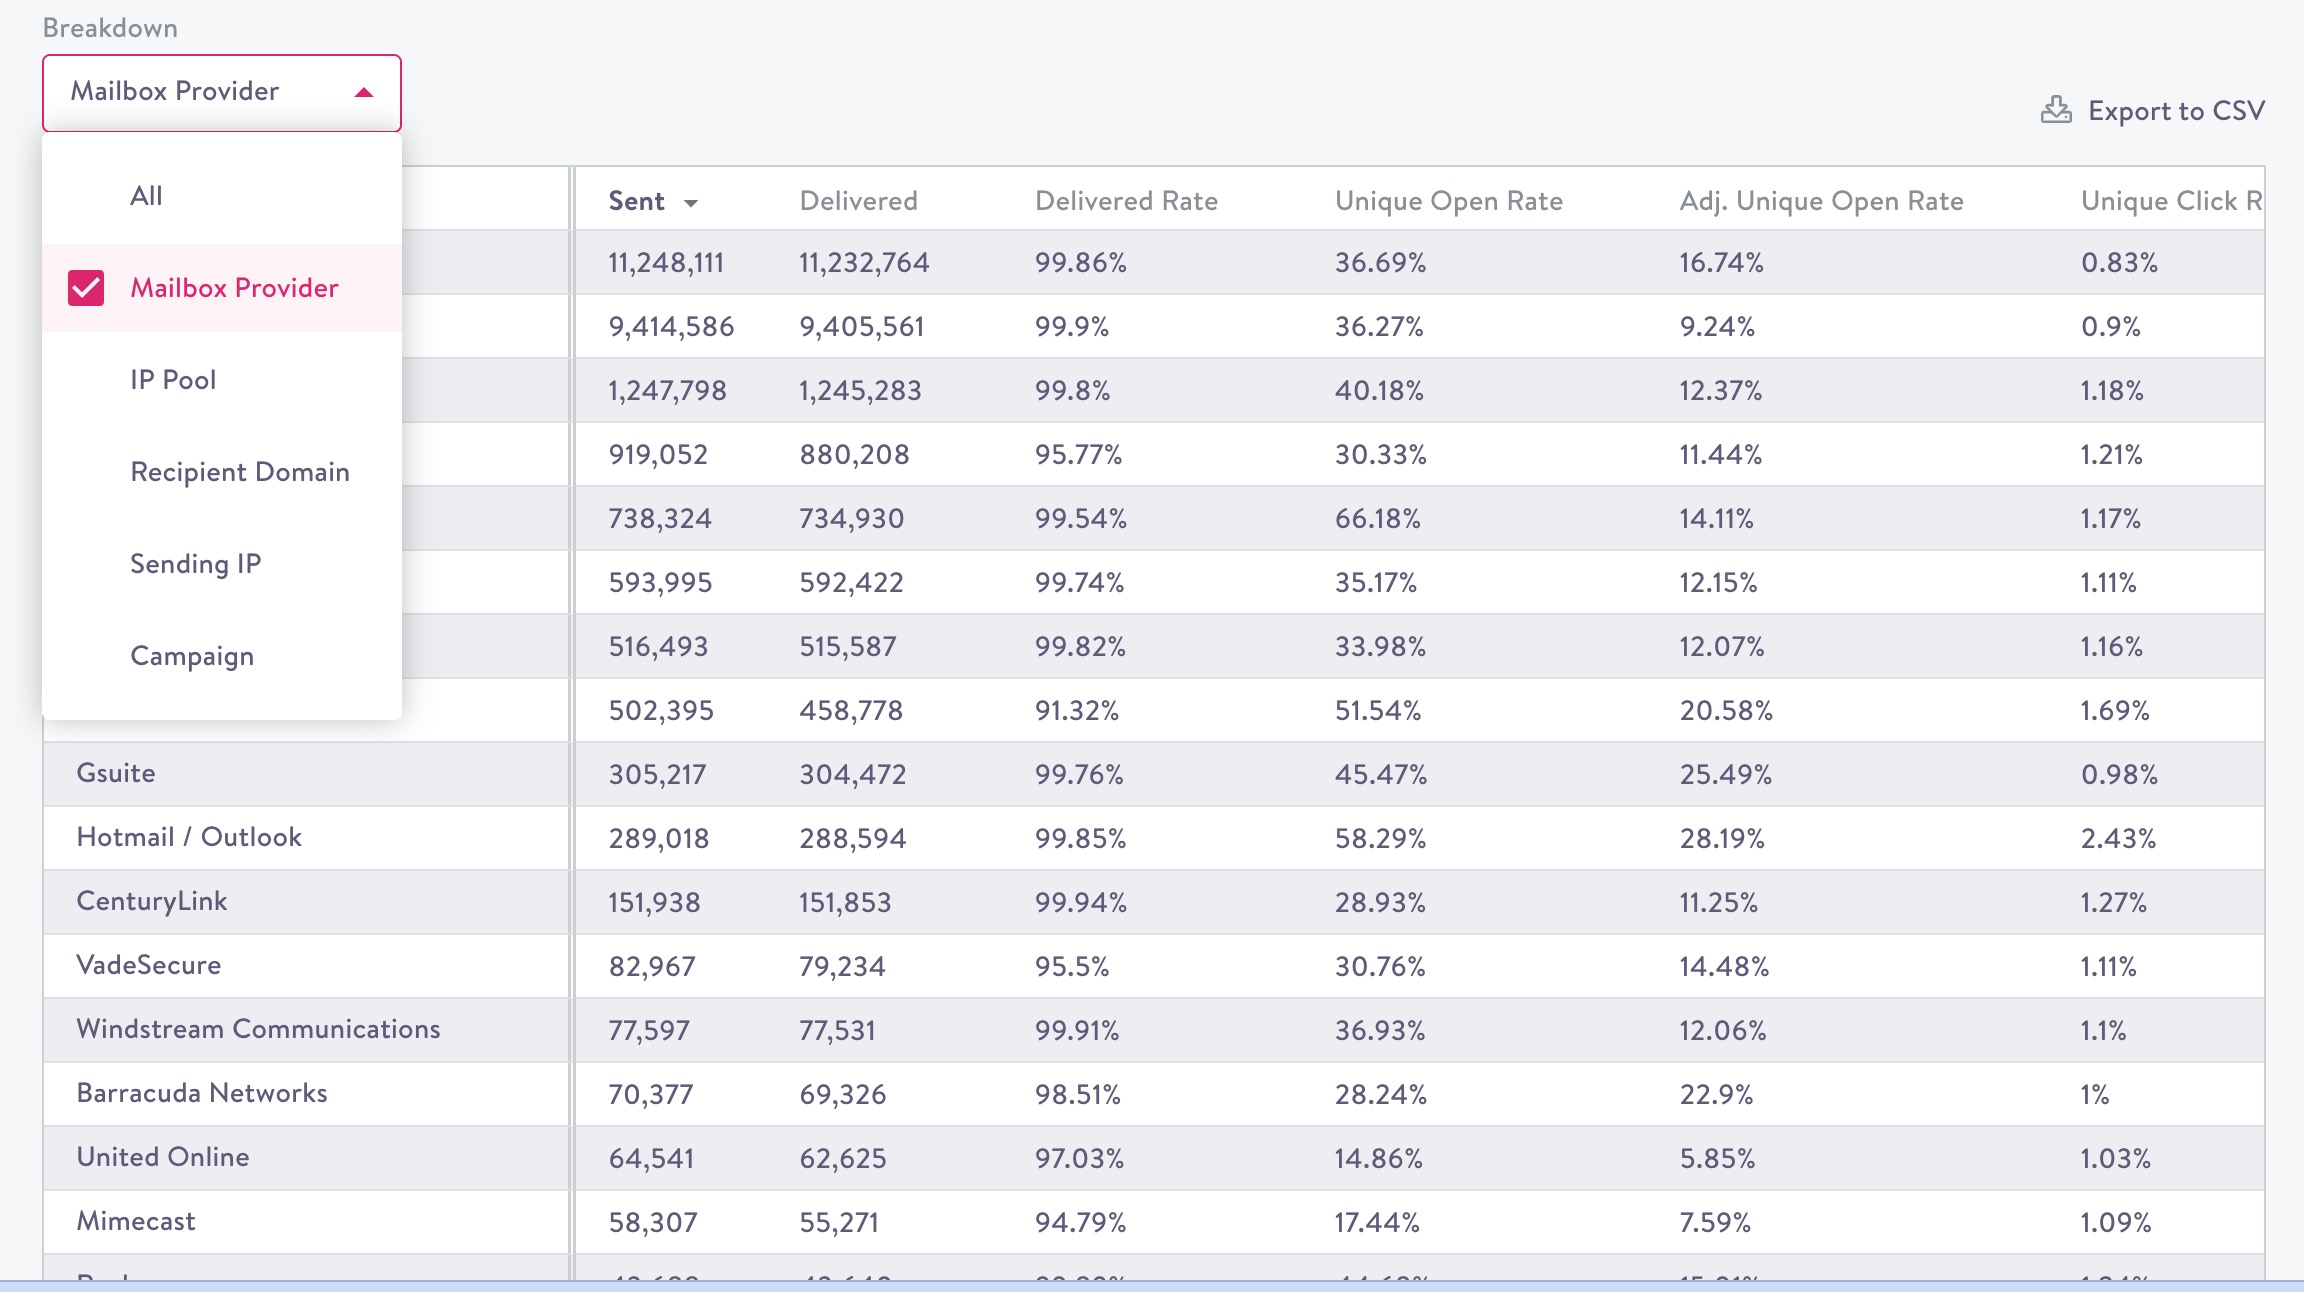
Breakdown
The final table displays a breakdown of all the metrics displayed previously. From the drop down, choose an option to filter the breakdown list by.
General Deliverability Health Guidelines by Metric
While typical results vary by sender, the following metrics represent what we typically see from marketing email programs that are:
- Healthy where most of the messages sent are landing in the inbox across most all mailbox providers,
- Mixed where some level of delivery disruption or filtering of messages to the spam folder is likely,
- And Needs Attention where there is very likely an acute need to address delivery disruptions, inboxing issues, or both in order to maximize the amount of mail delivered to recipients.
| Deliverability Metric | Healthy | Mixed | Needs Attention |
|---|---|---|---|
| Delivered Rate | 98% + | 95%-98% | < 95% |
| Unique Open Rate | 25% + | 15% - 25% | < 15% |
| Adj. Uniq. Open Rate | 10% + | 5% - 10% | < 5% |
| Uniq. Click Rate | 3% + | 1% - 3% | < 1% |
| Spam Complaint Rate | 0.05% < | 0.05% - 0.01% | > 0.1% |
| Bounces | < 2% | 2% - 5% | > 5% |
| Opt Out Rate | < 0.2% | 0.2% - 0.5% | > 0.5% |
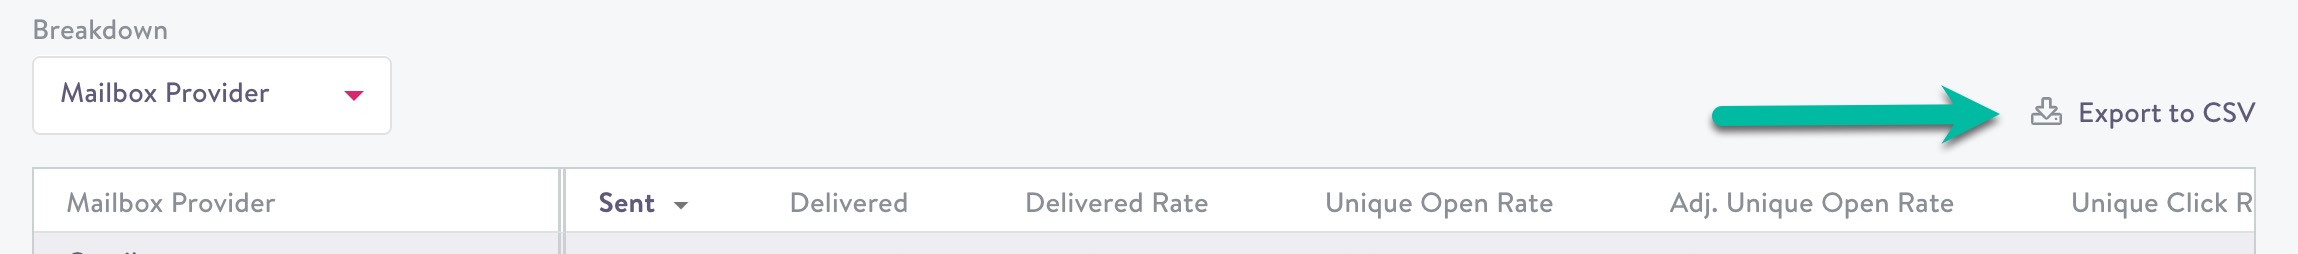
Export to CSV
You can export the breakdown to a CSV then download it by clicking the option above the breakdown table:
From the drop down, choose the result type you'd like exported from the options.
These additional fields appear in the exported CSV:
- Unique Open : the first open event associated with a particular message
- Adjusted Unique Open: the first non-prefetched open event or click event associated with a particular message
- Adjusted Delivered: number of messages accepted for delivery minus the number of messages where the only open event was associated with prefetching
Updated 8 months ago